
E-commerce+40%conversion lift
MouthShieldHeatmap analysis and six targeted changes took MouthShield from 4.69% to 6.6% conversion in 17 days.
Read case studyThe 2026 playbook for marketers.
A step-by-step guide to running your first A/B test. No code, no dev tickets, no agency.
Grona Team
Published 7 Jan 2026
You know your pricing page is underperforming. You know the hero headline is weak. You have three ideas for better CTAs.
But you also know that getting any of these changes live means filing a dev ticket, waiting for a sprint, and hoping it does not get deprioritized.
There is a faster way. You can A/B test your website without writing code, without waiting for developers, and without paying an agency.
You already know what to fix. The problem is getting it live. This is the playbook.
It is not lack of knowledge. It is lack of access.
Traditional A/B testing requires four things most marketing teams do not have:
For teams without dedicated CRO resources (which is up to 99.8% of websites, per Convert data), this creates an impossible barrier.
The result: marketers optimize ads, email, and social daily. They refresh creative weekly. They tweak targeting constantly. But the website stays untouched for months.
It is not a knowledge problem. It is an access problem. The workflow was designed for engineering teams with CRO specialists. Not for a marketing team of two.
Here is the full process, from picking a page to reading results. Each step works regardless of what tool you use, but the workflow maps naturally to a chat-first CRO approach.
Step 1
Pick your page
Find the highest-traffic page with the biggest conversion gap.
Step 2
Research competitors
Analyze 5 to 10 competitors to turn guesses into hypotheses.
Step 3
Describe the change
Type what you want in plain English. No code needed.
Step 4
Preview and refine
See the variant live. Iterate in seconds, not days.
Step 5
Go live
One click to launch. Results in days, not quarters.
Start with your highest-traffic page. Usually the homepage, a key product page, or a landing page receiving paid traffic.
Open Google Analytics. Sort pages by sessions. Look for pages with above-average traffic but below-average conversion rates. That gap is your opportunity.
Do not start with a low-traffic page. You need volume for statistical significance. A page with 500 monthly visitors will take months to reach a conclusive result. A page with 5,000+ visitors can produce a winner in 2 to 4 weeks.
Rule of thumb: pick the page where a 10% lift would have the biggest dollar impact. That is usually your highest-traffic conversion page.
Before changing anything, understand the landscape. Look at 5 to 10 competitors in your space.
What do their hero sections say? How do they structure their CTAs? What trust signals do they use? Where do they place social proof?
With Grona, you can ask the AI to analyze competitor pages through chat: "Show me how competitors in [industry] structure their pricing pages." The AI scrapes and compares, surfacing patterns you can act on.
You can also pull traffic data, ad intelligence, and see what messaging competitors use in their Google and Facebook ads.
The goal: spot patterns, not copy competitors. If 8 out of 10 competitors lead with outcomes ("Save 10 hours a week") and you lead with features ("AI-powered automation platform"), that is a testable hypothesis.
Research turns a guess into a hypothesis. Hypotheses produce better tests.
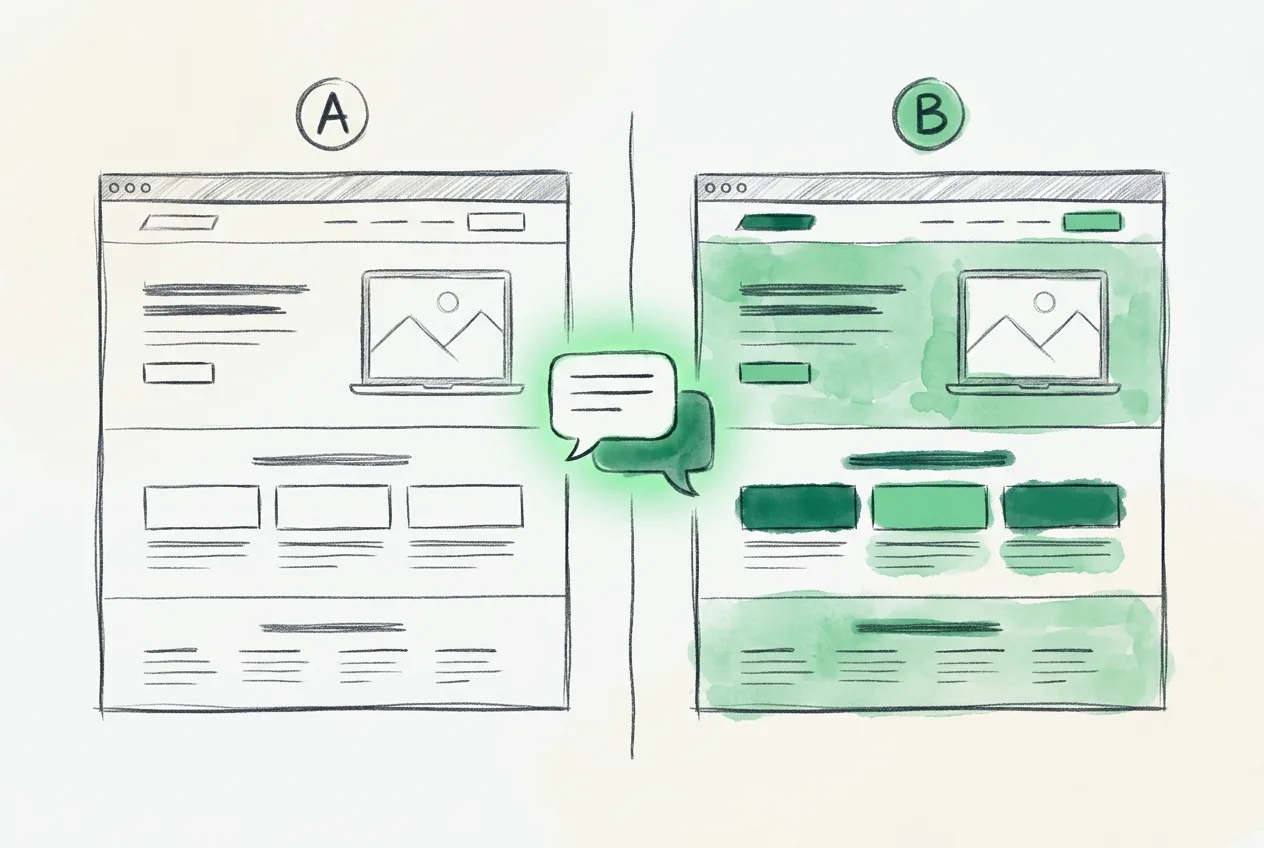
Once you have a hypothesis, describe what you want to change. Not in code. Not in a design file. In plain English.
Examples:
In Grona's chat interface, you type this. The AI edits the live preview of your site. You can also click elements directly in the preview and ask for suggestions.
No code. No design files. No handoffs. If you can describe the change in a sentence, you can make the change in a minute.
Your variation opens in a new tab within the editor. You see exactly what visitors will see. No surprises.
Not happy? Keep chatting. "Make the headline shorter." "Try a different CTA color." "Add a trust badge below the form."
Iterate until you are satisfied. This is the conversational part: describe, see, refine, repeat. Each round takes seconds, not days.
Describe, see, refine, repeat. Each iteration takes seconds.
One click launches the test. A single JavaScript snippet (already installed on your site) splits traffic between original and variation.
Conversions track automatically based on the goals you set. You see results in real time: visitors per variant, conversions per variant, and which variant is ahead.
Wait for statistical significance before declaring a winner. Most tests need 2 to 4 weeks depending on traffic volume. Do not end the test early because one variant "looks" better after three days. Statistical noise can mislead you.
When you have a winner at 95% confidence, implement it permanently and start the next test.
One click. Traffic splits. Results arrive in days, not quarters. Every cycle compounds. Each winning test raises the baseline for the next one.
Not sure where to start? Here are the five highest-impact tests, ranked by typical lift from industry benchmarks.
Potential lift: up to 15-45% (per GoStellar meta-analysis of 500+ tests).
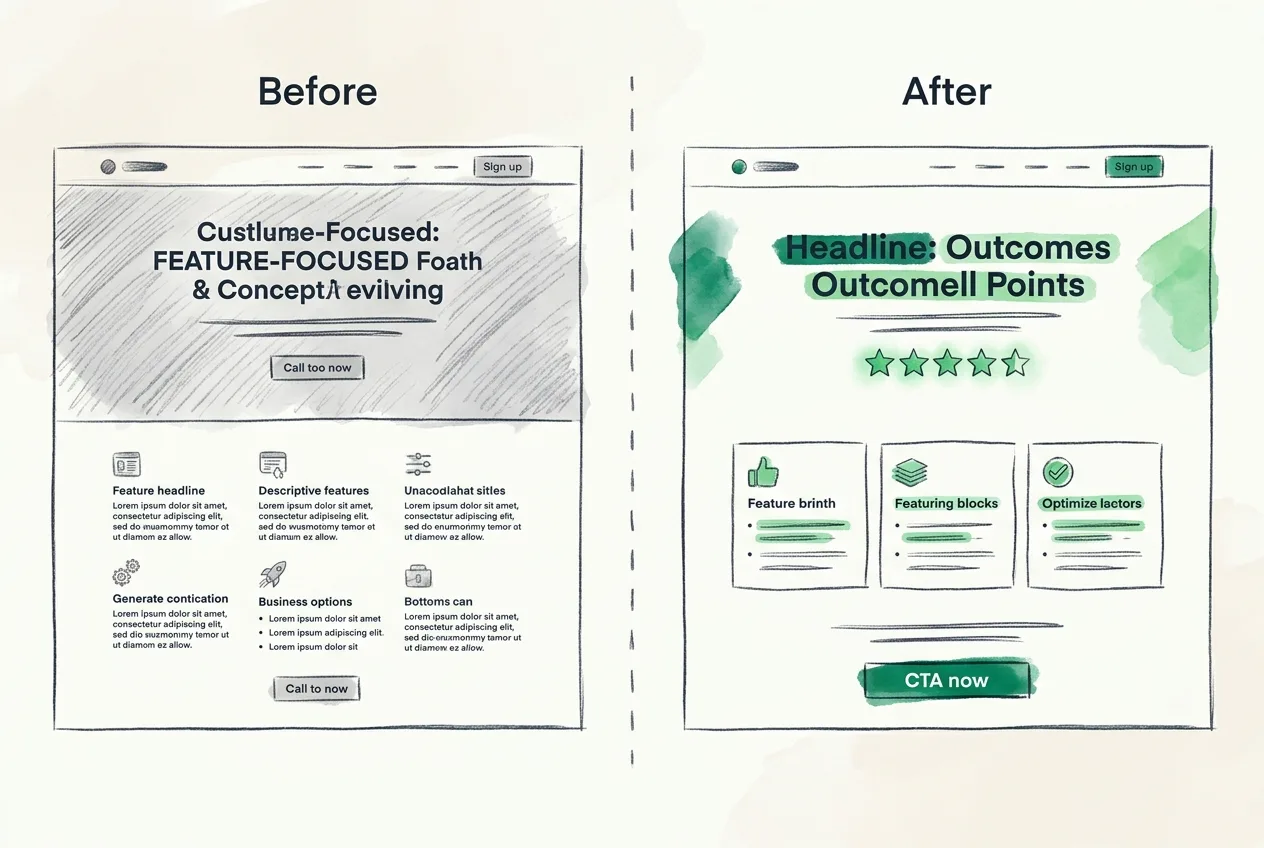
The first thing visitors read. Controls whether they stay or bounce. DermaClear rewrote their product headline from ingredient-focused to outcome-focused. Result: up to +33% add-to-cart lift in 12 days.
Potential lift: up to 12-35%.
The moment of conversion. Wording, color, position, and context all matter. BrightDesk changed their CTA from "Request Demo" to "See It in Action" and moved it above the fold. Result: up to +28% demo requests.
Potential lift: up to 12-66%.
Trust signals near the conversion point reduce friction. VitalEdge moved existing reviews from the bottom of the page to directly below the hero. Result: up to +29% conversion lift in 10 days.
Potential lift: up to 25-50%.
Every unnecessary field is a reason to leave. Cut fields that are not essential for the initial conversion. Ask for additional information after the visitor commits.
Potential lift: up to 20-50%.
Fewer choices, clearer path. Reduce navigation options on high-intent pages to keep visitors focused on one action.
Start with the biggest lever on your highest-traffic page. One test, one variable, one clear result.
Test one variable per experiment. If you change the headline, the CTA, and the layout at the same time, you will not know what caused the result.
Wait for 95% statistical significance. A test that "looks good" after 3 days and 200 visitors is not conclusive. Let the math finish.
A page with 300 monthly visitors will take 3 to 6 months to reach significance. Start with pages that get 1,000+ visitors per month.
"I think changing X will improve Y because Z" is better than "let us try something different." Research informs the hypothesis. The hypothesis shapes the test.
Every test, win or lose, teaches you something about your audience. Document the hypothesis, the result, and the takeaway. Each test should inform the next one.
A test that teaches you something about your audience is never a failure. A test you do not document is always a waste.
You do not need permission from your dev team to start testing. You need a URL and a hypothesis.
Pick your highest-traffic page. Research what competitors do. Describe one change. Launch it. Measure. That is the whole playbook.
Proof it works
Real businesses. Real metrics. All tested with Grona.
Heatmap analysis and six targeted changes took MouthShield from 4.69% to 6.6% conversion in 17 days.
Read case study
Headline rewrite from ingredients to outcomes. Up to +33% add-to-cart in 12 days.
Read case study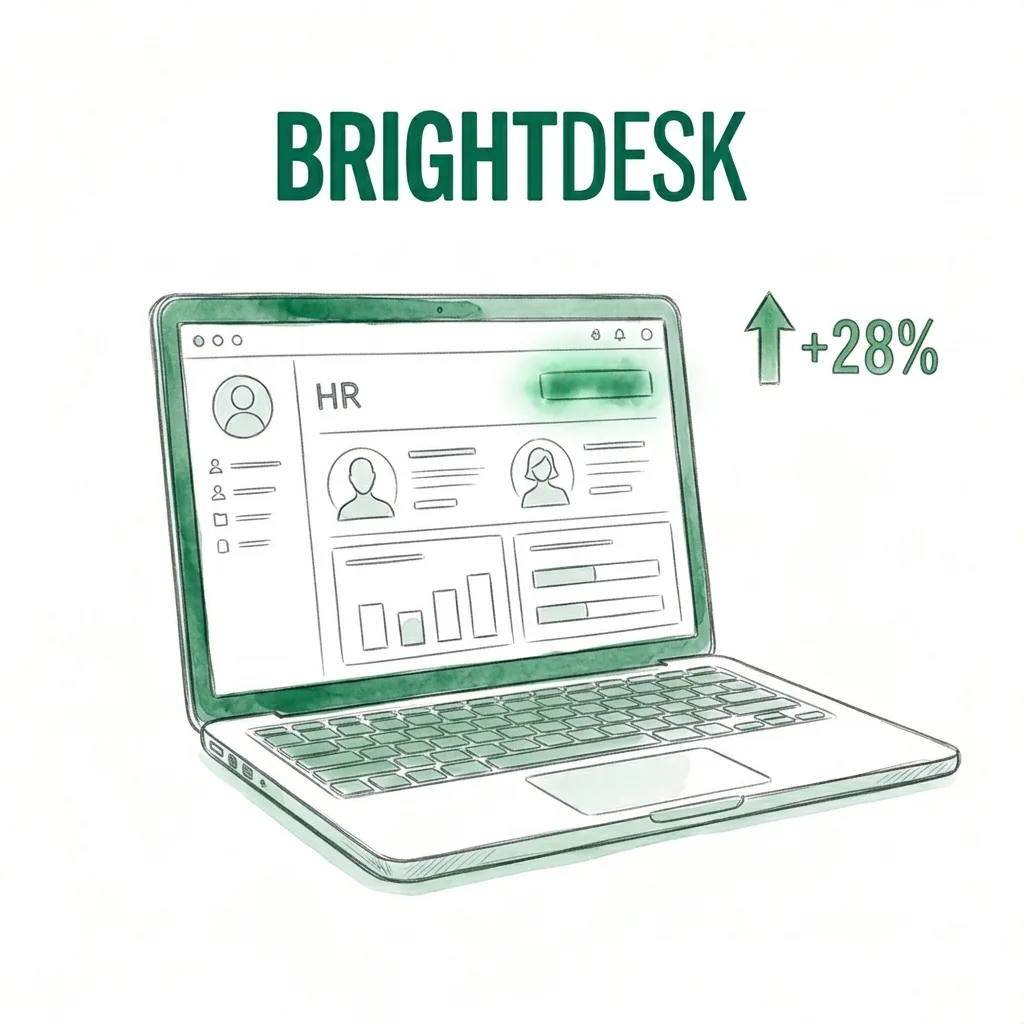
CTA optimization: changed copy and cut form fields from 9 to 5. Up to +28% demo requests in 14 days.
Read case study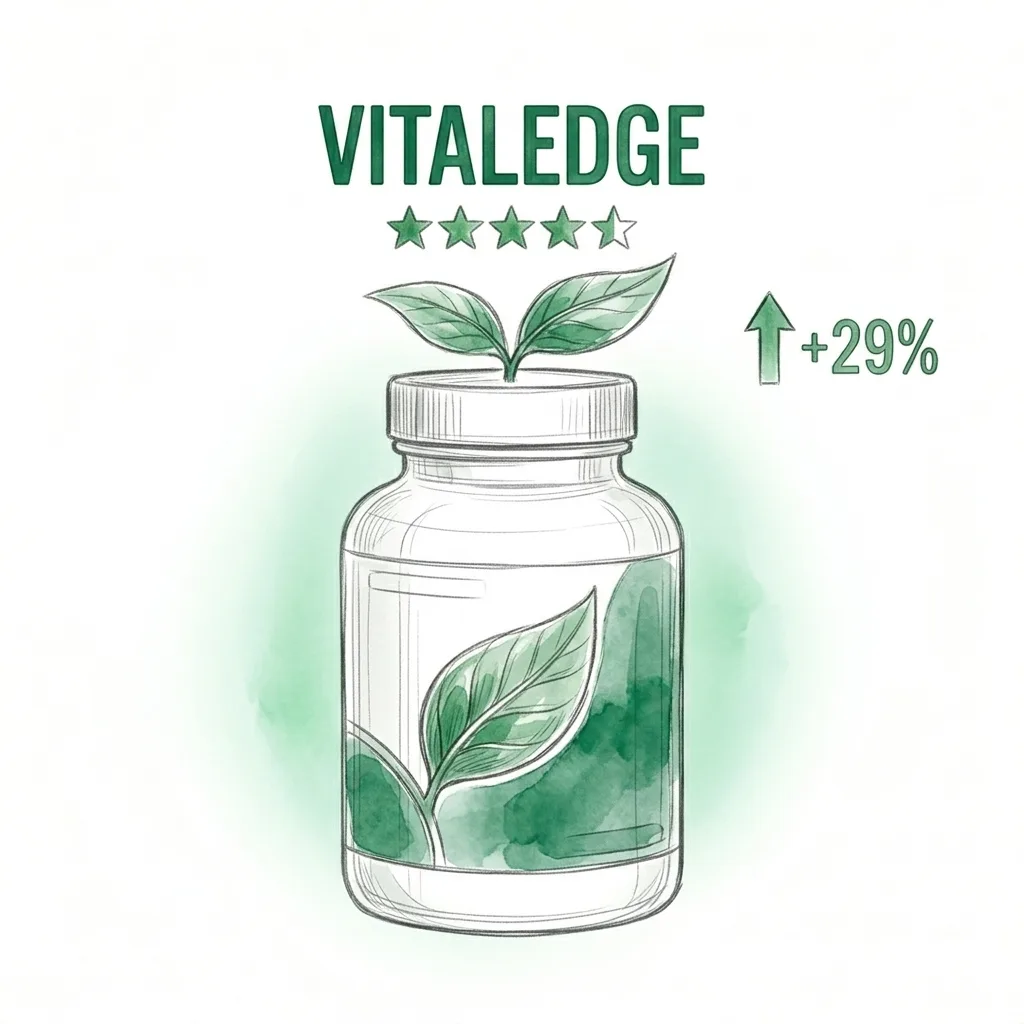
Social proof repositioning: moved 2,300+ reviews above the fold. Up to +29% conversions in 10 days.
Read case study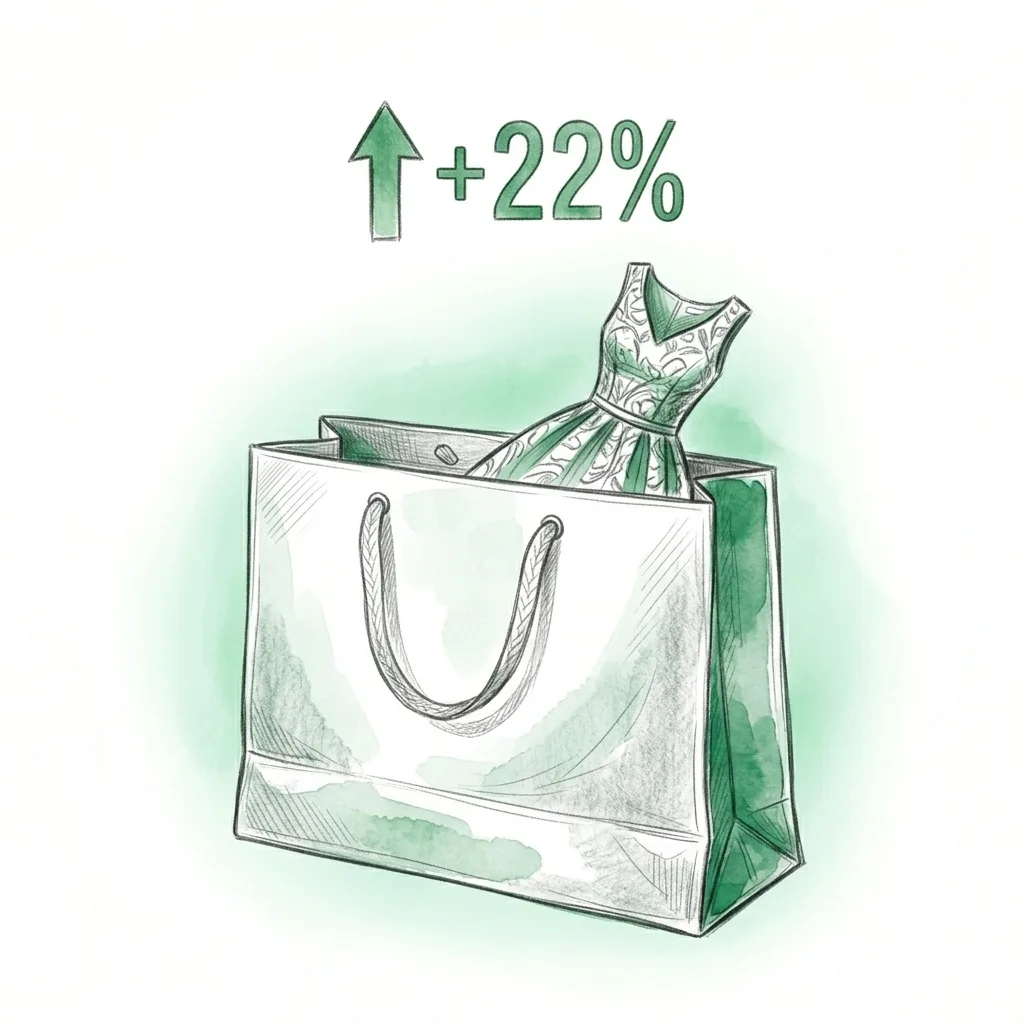
Checkout simplification: 11 fields to 7, added express pay. Up to +22% completed orders in 18 days.
Read case studyWeekly insights on A/B testing, personalization, and conversion optimization.